


After Donnie Veal followed up his nightmare Rule 5 season with a sparkling performance in the AFL, the reviews of his AFL season ran the gamut from people saying things like he looked as good as he did when he was a top prospect with the Cubs circa 2006/2007 and people saying that despite his stellar performance, it would be hard to really change the trajectory of his career after the huge steps backwards he’s taken in 2008 and 2009.
Luckily for us, MLB installed PitchFX cameras in two AFL stadiums (Peoria and Surprise) this year, so we have at least some data on Veal to compare to his big league season. It’s not really a whole lot; only three of Veal’s starts were in Peoria and Surprise and for some reason one of them didn’t register any data. That means we’ve got a whopping thirty-six Donnie Veal AFL pitches to look at, compared to 364 regular season pitches. It’s not a lot, and it’s not nearly enough to really draw any firm conclusions from, but I found some things that I think we can at least qualify under “interesting” and “worth thinking about.”
Follow along after the jump for the breakdowns. As always, PitchFX data was pulled from the invaluable BrooksBaseball.net.
The very first thing I wanted to do was to overlay the horizontal and vertical break charts for his AFL and MLB performances. If there’s anything different about his performances beyond control and velocity, it should show up here first.

If you’re uncertain what you’re looking at here, refer back to the PitchFX wiki and the section on break (keep in mind that what’s depicted here is very abstract; it’s not position or velocity at all, but break from the catcher’s perspective– the two important rules of thumb here are that horizontal break is just that, pitches towards the right of the chart break towards lefties, pitches towards the left break towards righties (but don’t imagine, and that positive numbers on the vertical axis do not indicate rise, but simply less drop — do not imagine the origin of the graph as a release point or the middle of the strike zone because it is neither). Remember that Veal is a lefty and so his pitch map is going to be flipped from the basic outline that we normally work from. The big cluster at the top right are almost all fastballs (the handful of pitches that sort of trail off towards the larger part of the x-axis map as changeups), the smaller cluster on the bottom left are curveballs.
It’s not hard to notice that most of Veal’s fastballs in the two AFL starts that we have data for show a little more break away from left-handed hitters. Using the chart from the wiki as the rough guide, they sort of behave like cutters. His curveballs also see more horizontal break and maybe a little less vertical break.
More break would certainly make him harder to hit, but it should also theoretically be harder to control and for a guy with huge control problems, the huge disparity raised some red flags for me. Besides the dramatically different sample sizes, there are slight deviations in positioning of the cameras in every ballpark, which is why I try to only use home data for guys that we have an abundance of data for like Zach Duke or Paul Maholm. It’s possible that the AFL cams are positioned a little differently, which could skew the breaks.
The first thing I wanted to do to look at this was pull out some of the points from one of Veal’s good appearances with the Pirates. The following chart is the same as the first one, with the pitches Veal threw against the Dodgers on September 25th highlighted. In that outing, Veal struck out three batters in two perfect innings, getting 22 of 33 pitches across for strikes.

OK, so Veal’s pitches from that outing don’t particularly resemble his AFL pitches, nor do they seem to dramatically deviate from his full season. Of course, we’re comparing the small sample of his 2009 pitches against the incredibly small sample of his AFL pitches, and we’re pulling out another incredibly small sample of one outing in September for extra comparison, but I’m forging ahead.
That Veal’s good outing in September doesn’t resemble his AFL pitches doesn’t definitively show anything; we’ve always known he has good stuff but lacked control. It’s not shocking that he rounded his control together one time during all of his outings with the Pirates to create a sparkling result. It’s still possible he changed something (grip? delivery/mechanics?) between when the season ended and the AFL began which gave his pitches a slightly different profile while improving his command.
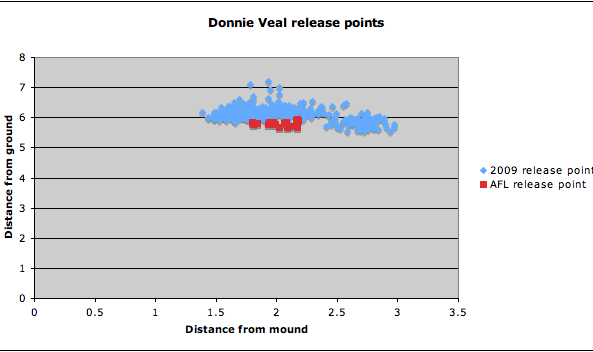
Because the PitchFX cameras can’t actually create break where there is none, if there were a bias in their cameras it would have to also be reflected in release point. That is, if it’s something about the way the cameras are positioned that’s giving Veal the appearance of more break away from lefties, we should see that his AFL release points appear to the left of his MLB release points on a chart comparing the two. But I don’t see that at all in this chart.

I’m a little loathe to read in to the big disparity in Major League release points for Veal because of the differences in the cameras in each park, but I don’t see enough difference in the AFL pitches to think that the difference on the first charts is created by the positioning of the cameras. Which is to say that if you look at the first chart and you believe the blue diamonds are representative of Donnie Veal’s pitches in his Major League outings this year, you should also believe that the red squares are representative of the two AFL outings that we have data for.
Because of the small sample, and the incompleteness of the AFL data, this doesn’t tell us much explicitly. What we know about Donnie Veal’s AFL stint is that he threw a lot more strikes. I mean I didn’t actually crawl through the AFL boxscores to add his balls and strikes up, but his K/BB ratio improved from 0.80 with the Pirates to 3.14 with Scottsdale. If he did that without throwing more strikes, I’m not really sure I know nearly as much about baseball or probability as I think I do.
Still, we can use the limited AFL data to at least give us an idea of why he saw such a dramatic turnaround. For one, in the two starts measured his fastball averaged 93.2 mph, well up from the 91.6 he averaged during the season (someone, I think Beyond the Boxscore, compared AFL PitchFX velocity to MLB PitchFX velocity and didn’t find much of a difference, but I can’t find that post for the life of me right now). Again, we’re working from a small sample, but that small sample shows us a faster fastball with more break away from lefties and a curveball with more horizontal movement. If we’re playing the speculation game here, I don’t think we’re dealing with a grip change here because if we were the velocity and movement would indicate a change from a two-seamer to a four-seamer, and Veal didn’t throw a two-seamer with the Pirates. Instead, I’m guessing that Veal (or Jeff Bannister and his staff, I guess) made some sort of mechanical tweak to his delivery, which doubled as a stabilizing factor that both made his delivery more repeatable (I know I said not to draw conclusions from his big league release points, but they really do seem to be all over the place), improving his command by extension, and slightly changed the way his fastball and curveball break.
One big difference for Veal simply could’ve been regular work. No pitcher’s delivery is truly “natural,” so the limited and irregular work that comes with being a Rule 5 pick is almost certainly going to create inconsistencies for a pitcher, especially since most Rule 5 guys are young with rough edges. I think that was Evan Meek’s biggest problem as a Pirate after he was a picked, because he almost immediately improved after the Pirates arranged a trade for him that allowed him to finish 2008 in the minors. For Veal, though, his problems probably ran a little deeper, and so the fix is a tougher one. The true test is whether or not whatever tweaks were made stick over the winter and into the spring and summer. And as much as I love looking at the PitchFX stuff, the only way we’re going to know if that happens is to keep watching Veal.