


On the surface, it’s easy to point to where Jeff Karstens’ surprising success is coming from in 2011: he’s throwing more strikes. Karstens is walking 1.5 hitters per nine innings this year, which is almost half of his career rate of 2.8 BB/9 before this season. His strikeout rate is up, too, and even though it’s not really that high (6.0 K/9), his K/BB ratio is almost 4:1 and anyone with a ratio like that is going to have success.
It’s a bit harder to figure out what he’s doing differently. He threws a whole slew of pitches (four-seamer, two-seamer, slider, change, curve) that make his PitchFX page a big amorphous jumble that’s awfully difficult to separate anything from. He hasn’t really gone and completely remade himself like Charlie Morton, either, so there’s probably not a whole lot that we’d learn from the break charts.
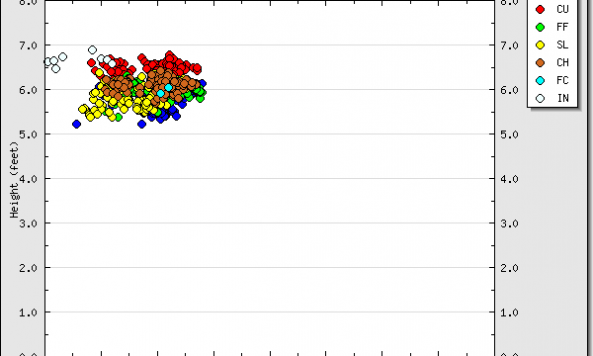
That’s not to say that there’s nothing to be learned about Karstens’ success this year. As I sifted through the data, I noticed a noticeable change in Karstens’ release point from last year to this year. The graphs are below with 2010 on top and 2011 following (from Joe Lefkowitz’s PitchFX database).

 Release points aren’t always easy to draw conclusions from, but it looks like in 2011 Karstens has both dropped his arm angle down slightly and become a lot more consistent with his release point than he was in 2010. A more consistent delivery would pretty logically lend itself to better control, which we’ve already established as a big factor in Karstens’ success this year. It’s also possible that it’s helping him hide the ball a little bit better, making him a bit tougher to hit.
The other thing that I think has made a big difference this year is the short leash that Clint Hurdle’s kept Karstens on. Karstens isn’t the most durable guy and we all know that. It’s not the end of the world to have one starter who has trouble getting through the sixth or seventh inning so long as you have a manager that knows his limits. So far in 2011, Karstens hasn’t exceeded 97 pitches in any start. He’s only gone over 90 twice and he’s made several starts where his pitch count has stayed in the 60-80 range. Last year he topped 100 twice, had two more starts over 90, and had six starts where his pitch count fell between 85 and 90.
If you look at Karsten’s splits from 2010, he struck out 64 hitters and walked just 18 with his first 75 pitches (that’s a K/BB ratio of 3.5, which is very close to his number from this year). Once he got over 75 pitches, though, he issued nine walks and had just eight strikeouts, despite those situations only making up a fraction of his work for the season. Karstens faced 525 batters last year, but only 60 of those came after he hit the 75 pitch mark in any given outing. In short, more than a third of his walks were issued in the 11% of opponent’s plate appearances that came after his 75th pitch. Starts like last night’s, where Hurdle hooks Karstens at what seems like a ridiculously early point, are probably a huge part of his success this year. The wheels fall of Karstens quickly once he gets over 75 pitches and Hurdle seems determined to nip that sort of collapse in the bud whenever he can.
I know that none of this seems groundbreaking, but we’ve seen Karstens pitch well in the past. Maybe the difference really is as small as a more consistent delivery and a manager more in tune with his his limits.