The Electric Meter is a semi-regular (nearly-daily?) in-depth look at the Pirates’ pitching staff. Today, we look at James McDonald’s 2011 season.
After James McDonald was traded to the Pirates last year, he had a nice late-season breakout. He struck out a bunch of batters, he kept his walks down, and he looked like the type of starter the Dodgers hoped he would be for the first time in his big league career. His start to 2011 hasn’t been nearly as good. He missed a big chunk of spring training with a side problem and in his first two starts this year he’s walked as many hitters as he’s struck out and looked rough around the edges at best.
The biggest difference I’ve seen in McDonald this year is that he doesn’t seem to be going to his changeup nearly as often as last year. His best start of 2010 was the first one he made against the Rockies with the Pirates. That night, he went to the change-up 16 times in 89 pitches and got a crazy eight swinging strikes (more than he got on his fastball and curve combined that night) on the pitch. I don’t have to tell you why a fastball/curveball/changeup guy is better than a fastball/curveball guy and McDonald’s change was in rare form that night, which was what made him so unhittable.
So far in two games this year, he’s gone to the change just 12 times in 190 pitches. His problem is that he’s not controlling it; he’s only thrown two of those 12 changeups for strikes. The thing is, he wasn’t all that good at throwing the changeup over the plate even when it was working for him. Of the 16 changes he threw against the Rockies last year, just three were in the strike zone. Here are the graphs (I went further down and verified each changeup for each game; all of the yellow dots are changes).


 (This is from the catcher’s perspective, so the left-hand side of the zone is the inside corner to a right-handed batter).
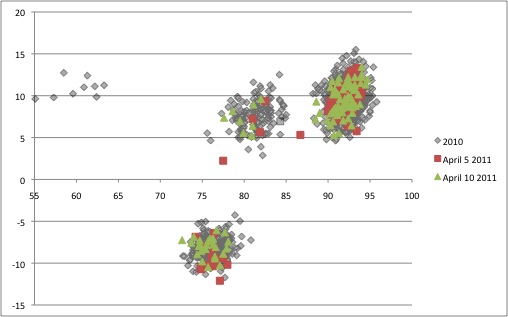
So what happened? Let’s first try to determine how McDonald’s 2011 change compares to the 2010 pitch. Because the changeup can often get lost in the horizontal-break v. vertical-break charts that I’ve been using for Charlie Morton, let’s look at speed v. h-break and speed v. v-break. It’s easy to pick the changeups out on these charts. First up is horizontal break (on the x-axis) vs. speed, the changeup is the smaller grouping on the left (the top grouping, the fastest pitches, are fastballs, curveballs have more movement away from right-handed hitters, so they’re on the bottom right). I can see where maybe he was having trouble getting a handle on the pitch against the Cardinals, but that didn’t seem to be a problem against the Rockies. His fastball and curve appear pretty similar, too, except that his fastball is showing a bit more break (that is, pitches that tail in towards righties, or show more negative horizontal break on this graph) than last year. I’m not sure if he’s throwing more two-seamers than last year, when he was clearly four-seam heavy or if it’s a function of something else. I’m not sure right now that it’s a big deal.  Next up is vertical break (on the y-axis) vs. speed. You can see the changeups, as they’re the slower pitches with less vertical break. I don’t think there’s much to see here; it looks like all of his pitches have similar vertical break to the 2010 versions.
  If we assume that there’s not much difference in the break of his pitches from 2010 to 2011 — and there doesn’t seem to be — then it’s tough to draw conclusions. I think that the most likely conclusion is that he’s probably not that comfortable with it after his layoff (the fastball and curve are his bread and butter) and so he’s staying away from it so far and we shouldn’t draw conclusions from 11 pitches. He needs to throw it more, though, because even if he’s not controlling it all that well it’s another variable that hitters have to consider when they’re at the plate against him.
PitchFX data from Brooks Baseball and Joe Lefkowitz’s PitchFX tool. Graphs not otherwise labeled are mine constructed from their data.


