If I had to guess, I’d say that the one Pirate-related question that I get asked more than any other is some variation on this one: “Is Pedro Alvarez ever going to put everything together?” Every spring training, every Alvarez hot streak, every Alvarez slump, they all bring the same question. Before 2014, my answer to the question never varied: “Look at his strikeout rate. It never changes. Look at his walk rate. It never changes. Until he learns to rein in his strikeouts and get on base more often, he’s always going to be the same Pedro.” For reference:
- 2010: 30.8% K/9.6% BB
- 2011: 30.5% K/9.2% BB
- 2012: 30.7% K/9.7% BB
- 2013: 30.3% K/7.8% BB
We don’t have to get too far into the weeds on this front, but I’m sure you’ll believe me when I tell you that there’s plenty of proof that hitters that strike out more than 30% of the time really have trouble being consistent middle-of-the-lineup mashers like we all once hoped Pedro Alvarez would be. Alvarez, of course, hasn’t been a bad player for the Pirates the last couple of years. It’s just that he’s been more Carlos Pena and less Prince Fielder than anyone would’ve hoped when he made his debut in 2010. His hot streaks are so tantalizing that everyone wants to see more of them, and his cold streaks are so frustrating that they’re almost unbearable to watch.
In 2014, Pedro Alvarez has cut down on his strikeouts, with just* 68 strikeouts in 286 PAs, which is a 23.8% rate. He’s drawn 31 walks in that same span, a 10.8% rate. He is walking more and striking out less, which is all that I’ve ever wanted to see Pedro Alvarez do. And now he’s slugging .394 (.467 and .473 in the last two years, for reference) and his ISO is .161 (.223 and .240) and he’s only on pace for about 25 homers. He hasn’t really been a terrible hitter this year (his wRC+ is 99, thanks to a .318 OBP that would be his highest since his rookie year), but he really hasn’t been Pedro Alvarez to this point, either. Combine the loss of power with his terrible defense and he’s playing badly enough that it’s not entirely out of place to be wondering at this point if Josh Harrison should be doing more than platooning with him once Neil Walker returns from the disabled list.**
The basic hypothesis that most people have come up with is that Pedro’s patience has diminished his power. That seems like a sound theory, but we’ve got what amounts to an endless amount of PitchFX data at our fingertips in 2014, and we can use it to look at hitters just as easily as we can look at pitchers. I can’t help but want to put this hypothesis to the test.
We’re going to get to some heat maps in a second, but before we get there let’s start out with some raw discipline numbers from FanGraphs. Staring with his rookie year from 2010, let’s look at Alvarez’s out-of-zone swing percentage (O-Swing%), his in-zone swing percentage (Z-Swing%), and his total swing percentage (Swing%).
- 2010: 27.2% (O-Swing%) / 59.6% (Z-Swing%) / 42.9% (Swing%)
- 2011: 29.9%/63.5%/46.1%
- 2012: 31.8%/65.4%/47.5%
- 2013: 33.2%/70.0%/49.5%
- 2014: 31.8%/67.6%/47%
Can I be honest? I love that 2010-2013 trend a little bit. If you want to apply a narrative arc to it, Alvarez was (relatively) tentative in 2010 and 2011 when he first came up, and he struggled quite a bit for it. He didn’t fix his problem by becoming more selective or discerning — oh no, he fixed it by just swinging out of his shoes at everything that looked like a baseball that came his way. And it kind of worked! His 2010 season was exceptionally hot-and-cold and 2011 season was really awful, but he was a productive player in 2012 and 2013. He was incredibly one-dimensional and homer-dependent, sure, but he was productive. Still, the strikeouts and low OBP were his weaknesses, and he certainly was swinging a lot more than most other players (the league average Swing% last year was about 45%, and that 5% difference really bears itself out over the course of the season).
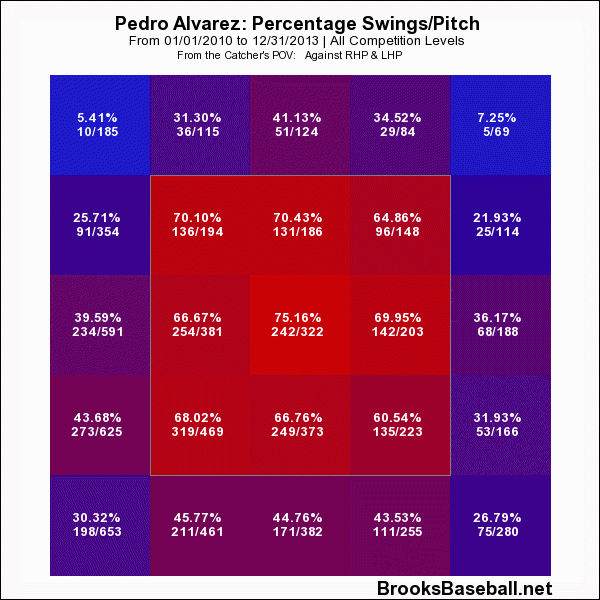
Now that we’ve got the basic swing trends down, let’s start with a simple question. In terms of pitch location, what sorts of pitches did Pedro Alvarez swing at in the first four years of his career? The answer will not surprise you, because it’s “pretty much everything.”
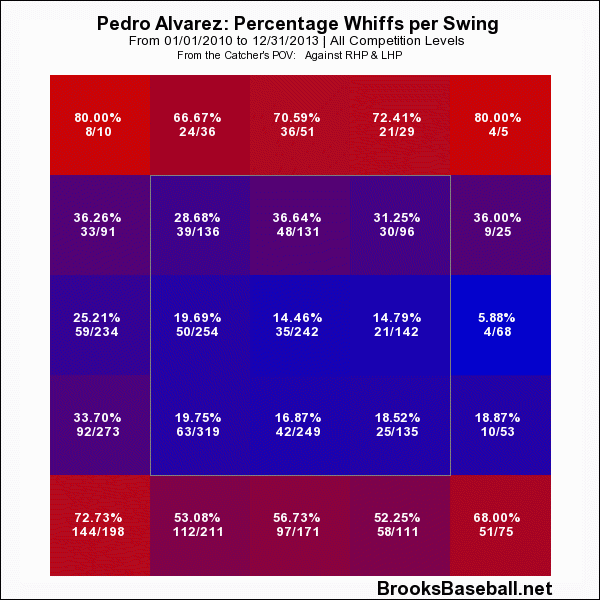
Now let’s take that question and extend it just a bit. In terms of locations, what sorts of pitches did Pedro Alvarez swing-and-miss at in the first four years of his career? Again, the answer will not surprise you.
Diagnosing the problem here is easy: between 2010 and 2013, Alvarez was swinging at ~45% of pitches that were over the plate but below the strike zone and whiffing on more than half of those swings. He was swinging at ~35% of pitches over the plate but above the strike zone and whiffing on close to 70% of those swings. Basically, if you were throwing the ball over the plate but not in the strike zone, Pedro Alvarez was probably swinging and missing at the pitch. In particular, it looks like he was weak with pitches that climbed the ladder more than low pitches.
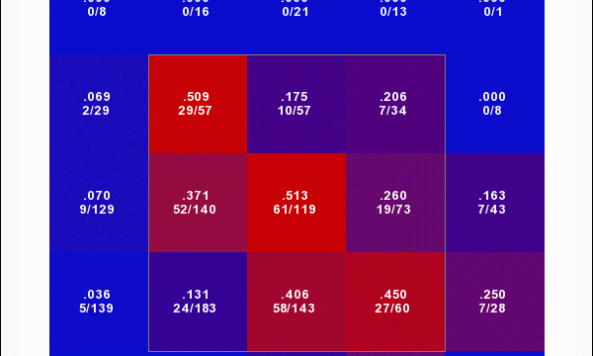
You can see the real problem when you look at where his power was coming from in those years. It’s essentially a checker board down the strike zone (quick note: I’m using isolated power here, which is extra bases per at-bat, or slugging percentage minus batting average (a double is one extra base, a triple is two, a homer is three): this would mean that of Alvarez’s 119 at-bats between 2010 and 2013 that ended on a pitch right down the middle of the plate, he had 64 extra bases from doubles, triples, and homers): 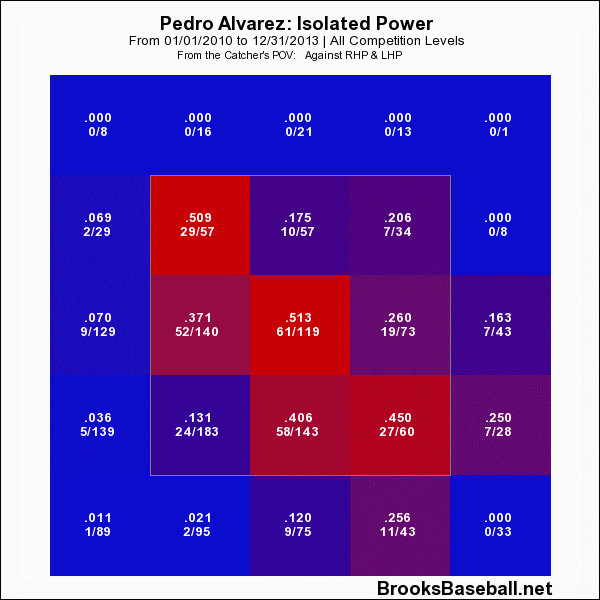
Pedro could absolutely mash pitches up and away from him, so he always chased up. He could mash pitches down and in on him, so he always chased down. The problem is that his power zones and his whiff zones bleed right into each other, and the result was the homer-heavy strikeout-happy Pedro Alvarez that we were familiar with.
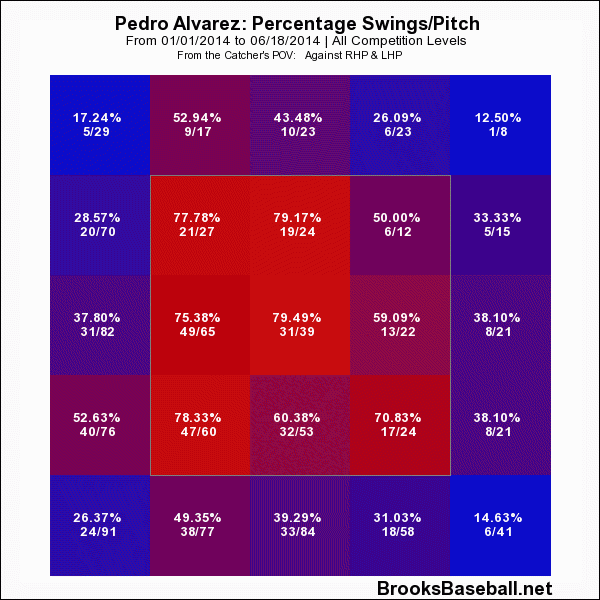
Let’s run those same four charts for 2014 and see how they compare. Before we get started, let’s apply the usual sample size caveat: the 2010-2013 numbers are for Alvarez’s whole career and the 2014 numbers are for 2 1/2 months. Obviously there are some trends that maybe haven’t normalized themselves. OK, let’s go. First, we’ll take swing rate.
Well, that looks a little bit better, right? He’s definitely laying off of high pitches more this year, which was one of his weaknesses of his in the past. He’s doing better with low pitches, too, which was his other big weakness. So is the difference that he’s swing-and-missing less or just that he’s swinging less? Let’s bring this year’s whiff-rate chart up:
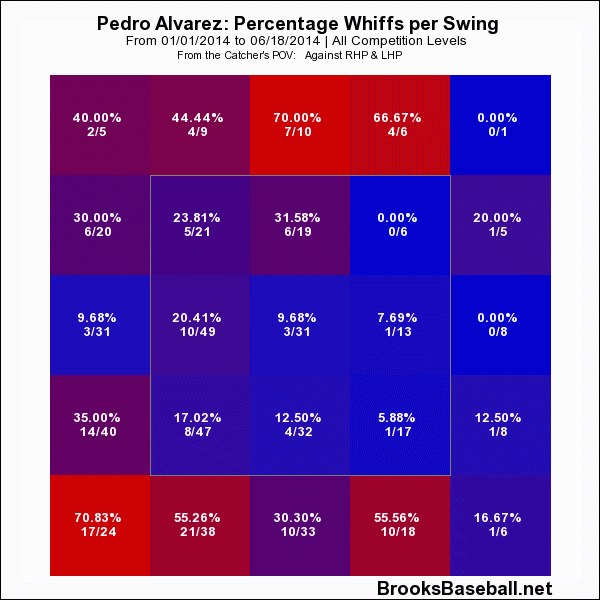 This looks a little better, too. Whereas the top and bottom borders of his whiff chart were just red on the 2010-2013 chart, here there’s at least some blue and purple. He is definitely not swinging as much, and he’s definitely whiffing less when he does swing. But what about the power?
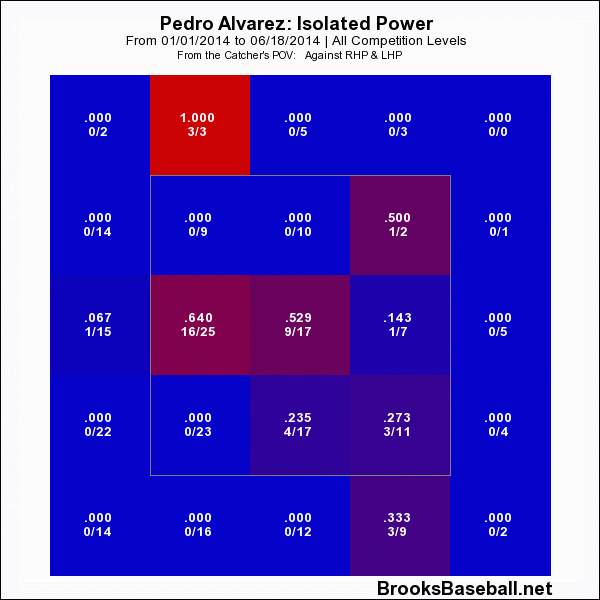
Oh. Pedro’s down-and-in and up-and-out hot-spot are both more or less gone. Basically, the only thing he’s hitting for power this year is middle/middle or middle/slightly-outside.
Now, its hard to draw conclusions since the 2014 data is limited at this point, but it looks to me like Alvarez came into the season knowing that his big weaknesses where pitches over the plate but out of the strike zone, and he’s being cautious with those pitches. The problem goes back to that checkerboard ISO pattern from 2010-2013: by being more cautious with the pitches that are out of the zone that he can’t hit, he’s also being more cautious in two of his three best power zones from the base, because they’re both awfully close to the places that he struggles. Seriously, look at that hot zone on the up-and-out pitch from the 2010-2013 graph; it’s on an island all by itself in a sea of blue, and you can see why from the whiff chart right above it.
The larger question looming here is obvious: Can he be more selective and also still cut loose and hit for power? I don’t know the answer to that question. The early results this year are not great, but it’s important to not forget that they’re also early results. If anything, I think it’s encouraging that he’s both being more selective and swinging and missing less. That indicates an actual change in approach to me, rather than him just shortening his swing and trying to miss less or just taking more and more pitches. I do think it’s possible that as the season goes on, he’ll keep adjusting and figure out when he can really cut loose vs. when he shouldn’t, but it’ll probably have to be some kind of happy medium between a 31% strikeout rate and a 24% strikeout rate. In any case, there’s a better answer to the question, “When will Pedro Alvarez really break out?” The answer is when he can drive the up-and-out pitch the other way without always chasing even higher fastballs, and when he can turn on that down-and-in pitch and rip it down the line without going fishing for even lower pitches.
* Just! Baseball in 2014 is strange.
**Oh, we are NOT having this conversation today, because I’m just not ready to fight with everyone about it. But we probably will soon.

