


After Ross Ohlendorf threw gas in the mountains last week and followed that up with a start last night in which he averaged around 92 mph and topped out at almost 95, I thought it would be a good idea to go into the PitchFX (thanks to Brooks Baseball, as always) and track his average fastball velocity through the season.
Before I share the chart, just a quick note on the numbers. I used his average four-seam fastball velocity to make this graph. On some nights, especially earlier in the season, he had anywhere between 10 and 30 fastballs classified as two-seamers. In every start except for the first two, the two-seamer tracks about 0.3-0.5 mph slower than the four-seamer (in his first couple, it’s just a tick higher). I started off averaging the speeds for both pitches to get an average for all of his fastballs, but because the number of two-seamers was almost always a good bit smaller than the four seamers, they didn’t actually affect the averages that much. So while these numbers aren’t “dead-on balls accurate”, as they say, they’re pretty good and if anything, the early totals are just a smidge high.

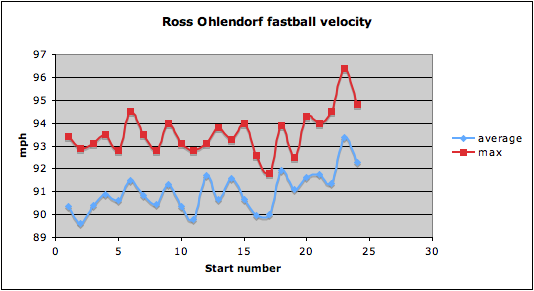
The “start number” corresponds with his Baseball-Reference gamelog. Anyways, it’s pretty clear to see that even without his huge spike in velocity against Colorado (something that I think is real; start #14 was at Coors Field as well and while it was one of his harder throwing starts to that point in the season, it wasn’t a seeming outlier like the one he made last week, which is to say that there’s no reason to think their gun is juiced and so no reason to doubt the numbers) he’s been throwing consistently harder since his start against Philadelphia on July 11th. Before that start, his average fastball was better than 91 mph four times in 17 starts. Since then, he’s run off seven in a row with an average of better than 91 and his last two starts were the first two this year in which he averaged 92 or better. You can also see his max fastball from each start picking up; prior to that start against Philly, there were only four nights that he topped out at 94 or better. Since then, he’s done it five times with his hardest pitches of the season coming in his last two starts.
In those seven starts, he’s 4-3 with a 3.00 ERA and he’s averaged six innings a start. That doesn’t tell the whole story, though, because his K/BB ratio is a pretty terrible 23/19 in that span and his WHIP is a non-sparkling 1.38. He’s getting hit pretty hard, too, with 6 homers, 7 doubles, and 2 triples allowed in that span. His groundball/flyball ratio is 1.2 over those 7 games, but that’s exactly what it was in the 17 starts he made before that.
So he’s throwing harder with better superficial results, even though he’s getting hit harder and actually pitching worse.